
Agricultural Parity Charts
Historical records of the performance of our economy have been the focus of NORM’s investigations ever since Carl H. Wilken began this study in the 1930s. We now have 100 years of information concerning farm parity and how the “ups” and “downs” of our nation’s agricultural profitability have affected our overall economic health. The first chart below was published in Carl Wilken’s 1947 book Prosperity Unlimited (pp. 92-93).
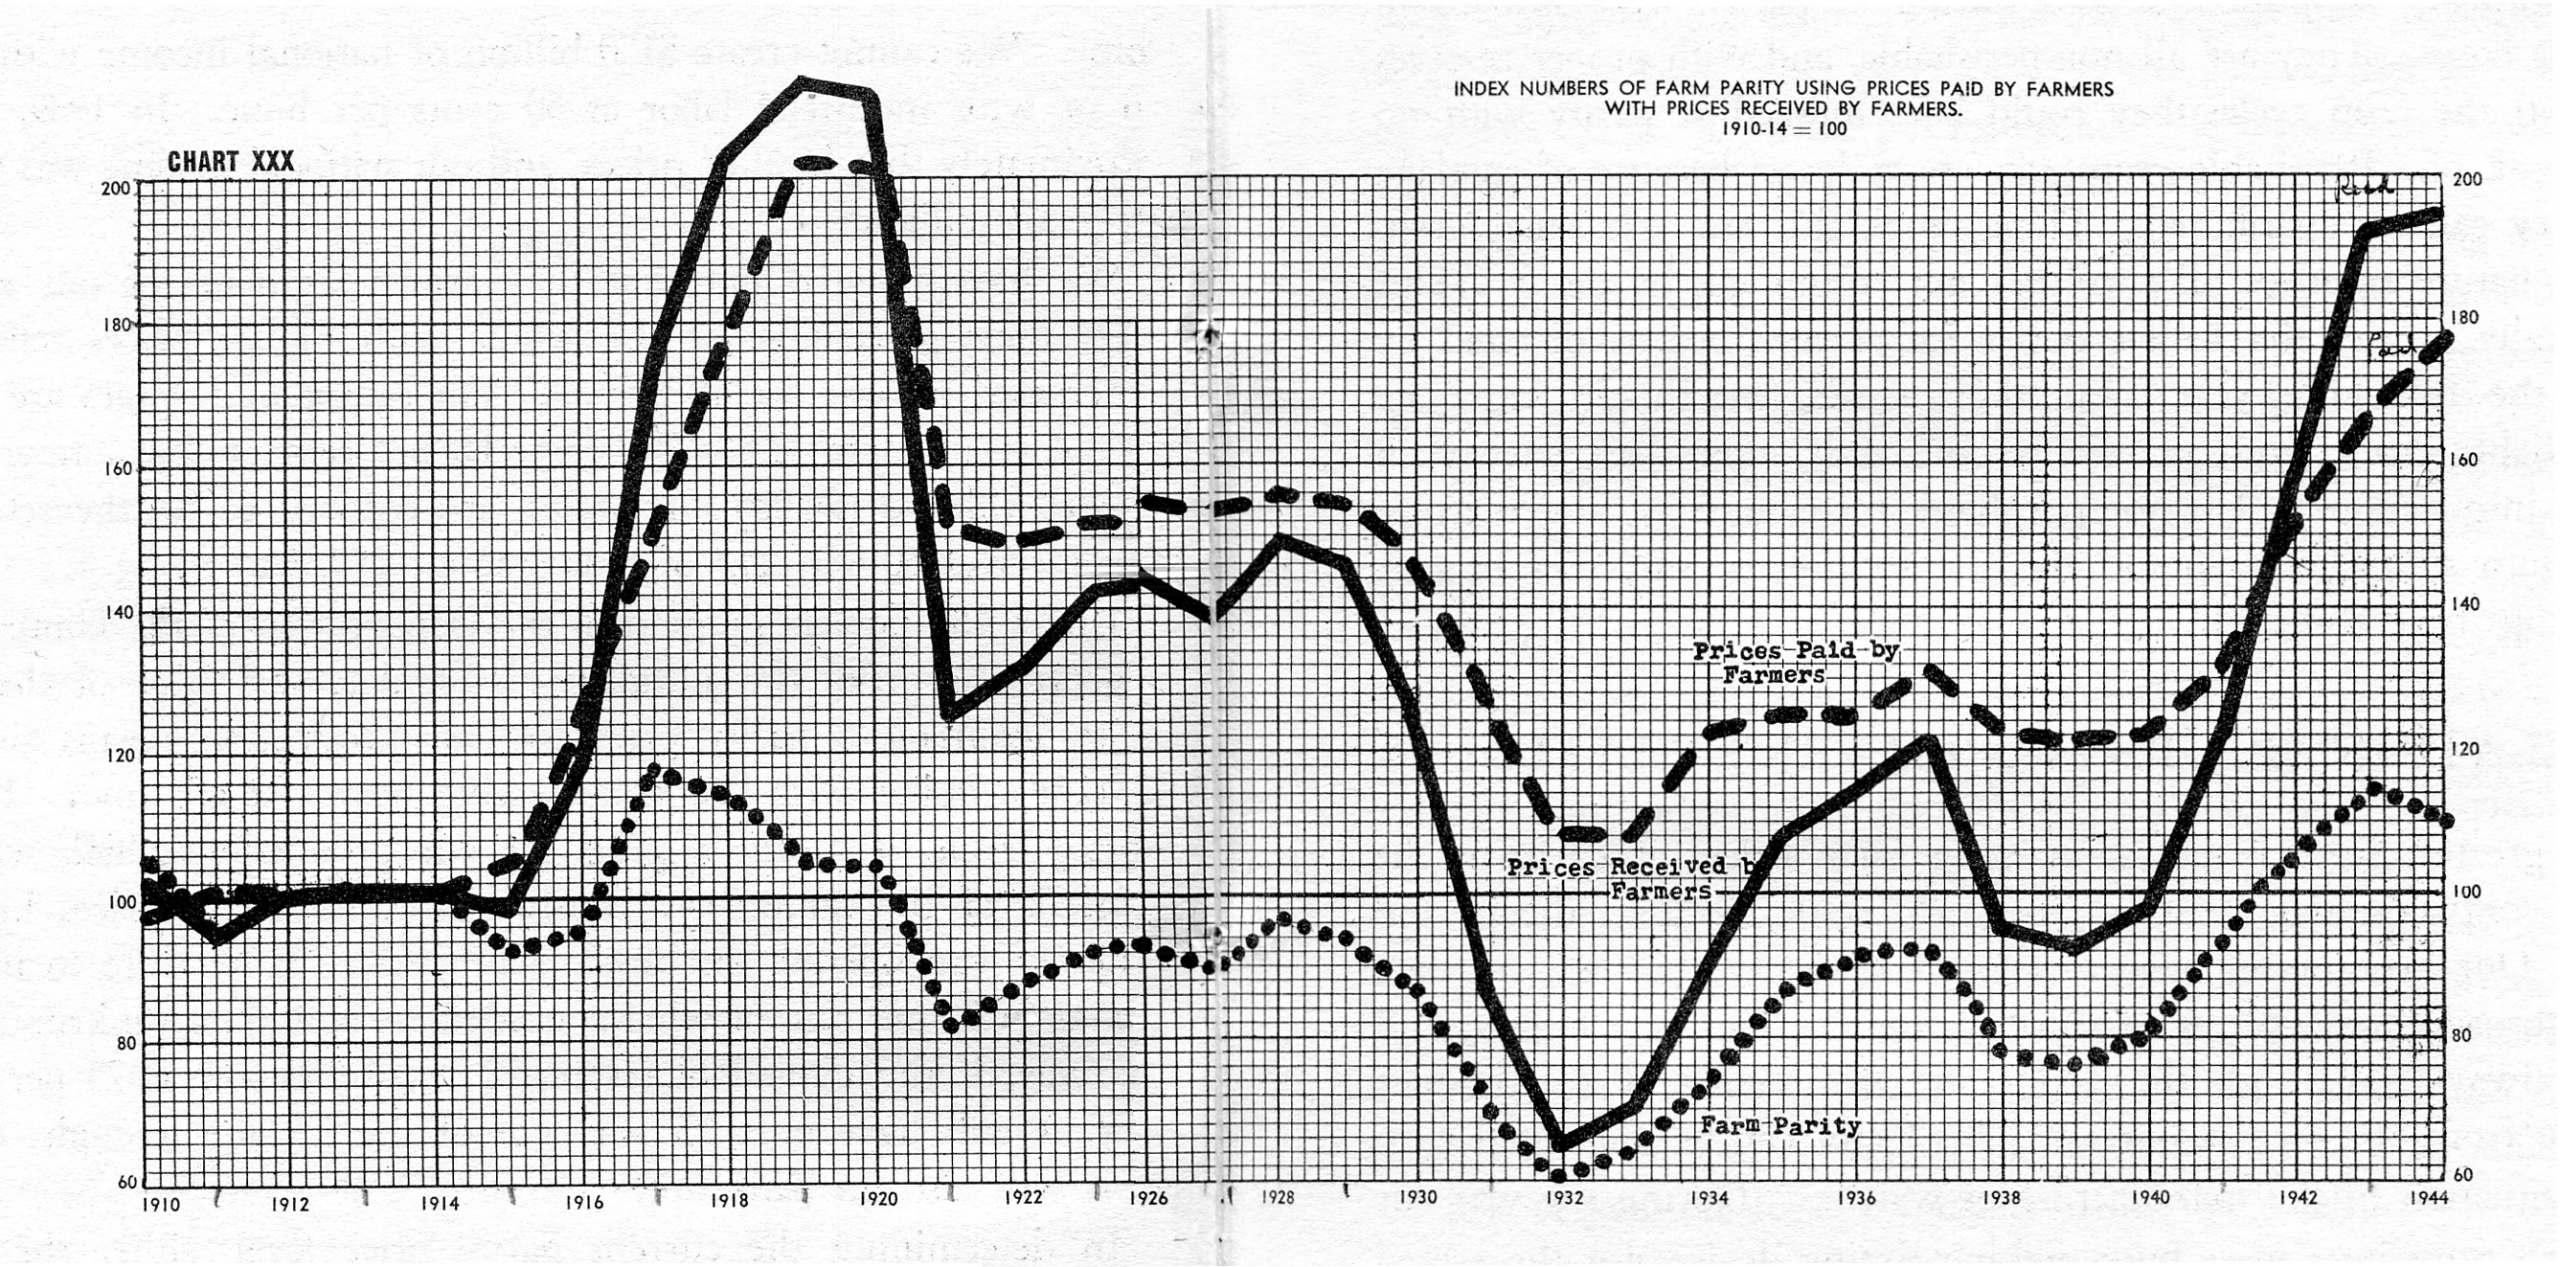
This chart covers the time period from 1910 through 1944. The solid line shows the changes in the “Index of Prices Received,” the dashed line indicates changes in the “Index of Prices Paid” and the dotted line shows the ratio of those two indices (Prices Received divided by Prices Paid). The dotted line charts the Parity Ratio, as it is called. All indices are referenced to the 1910 to 1914 period of price relationships as being 100. This simply gives us a straightforward way to compare the price relationships across time.
Fortunately for us, USDA has a legal requirement to continue to calculate these indices using the same reference period (1910 – 1914 = 100). The “Prices Paid” index (PPITW) and the “Parity Ratio” are published every month in Agricultural Prices Monthly available through the National Agricultural Statistics Service (NASS).
We have compiled the records to continue “Chart XXX,” displaying 100 years (1910 – 2009) of actual performance.
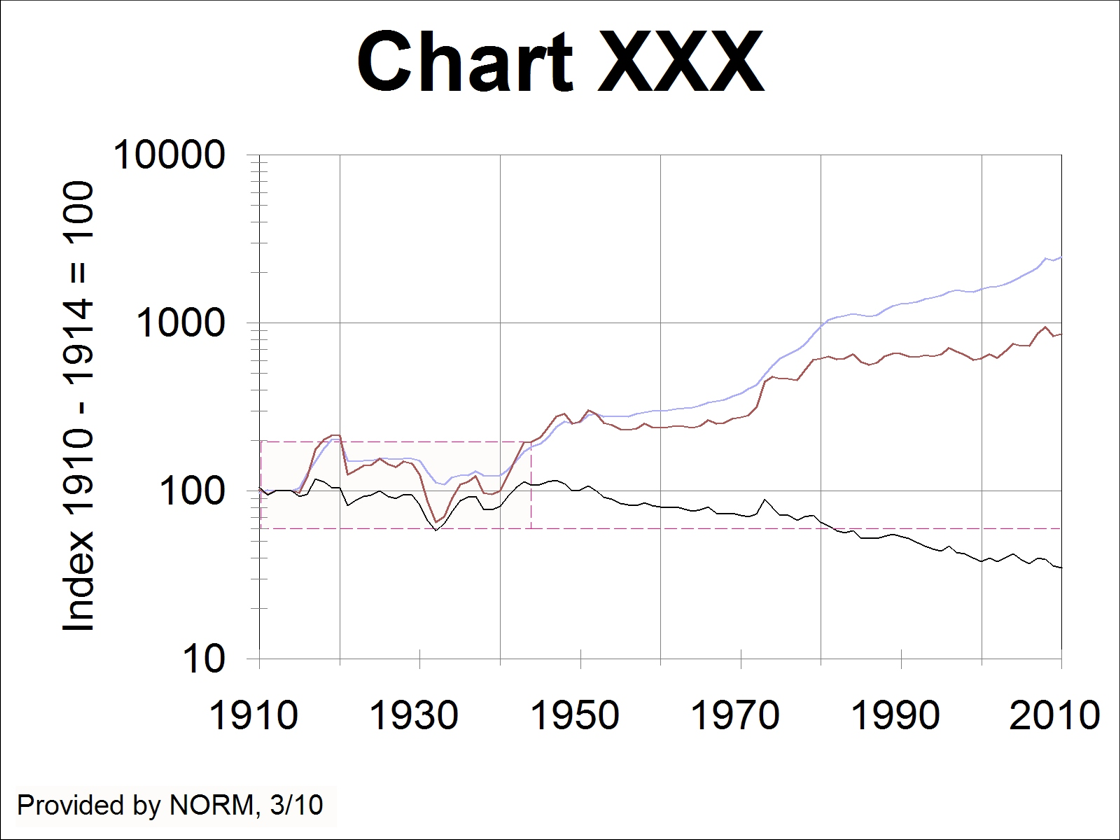
In this chart the dark red line is the same as the solid line in the first chart, “Index of Prices Received.” The blue line is the same as the dashed line in the first chart, “Index of Prices Paid.” The black line is the same as the dotted line in the first chart, the “Parity Ratio.” The box created by the red-dashed line indicates the same data displayed in the first chart. The red dashed line stretching out to the right shows the lowest point of parity during the Great Depression (1932) and the fact that agricultural parity fell below that point in 1982 and hasn’t yet recovered. In fact ag parity is still declining.
The interesting feature of this chart is the Y-axis scale. These data lines are drawn using a logarithmic scale. This helps to display the detail of the original chart and yet shows the trends of the indices and ratio since the end of that chart (1944). To get a truer impression of the scale of damage to our nation’s agricultural production sector and the necessary impact on the national economic condition, we will chart the same data using the same (arithmetic) scale of the original Wilken chart.
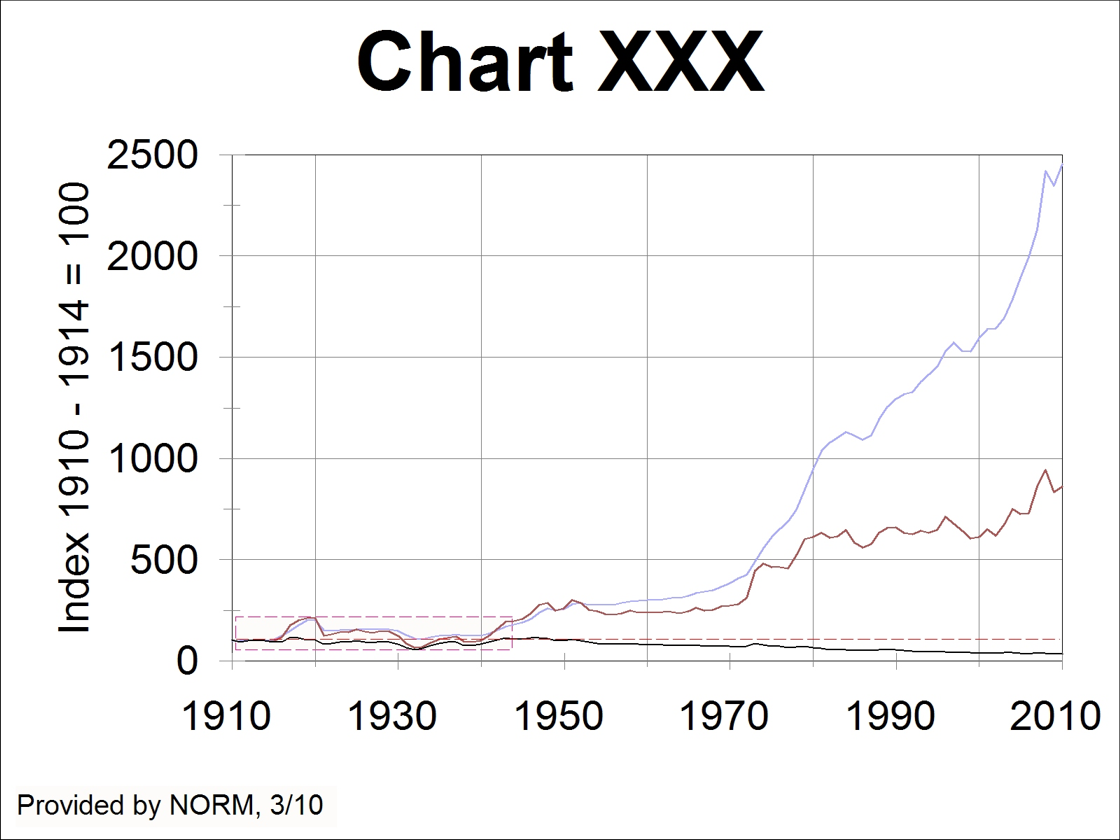
In this chart the red-dashed line box covers the data of the original chart and the red-dashed line indicates the 100% parity axis. Particularly over the last 38 years, our economy has become so out of control, loopy on debt, that prices paid by farmers have increased by a factor of 24.6 while prices received by farmers have only increased by a factor of 8.6, giving us (8.6 ÷ 24.6) the current parity ratio of 35%.
Real earned income, the result of units of new wealth produced, multiplied by the price at which each unit is sold, puts the floor under the nation’s economy, from manufacturing to retailing to services to luxuries. Without earned income no debt can ever be paid. By cheating our agricultural producers, our mineral, metal, fuel and recycling producers, of the proper earnings to which they are entitled, we can look ahead to losing our form of government (democratic republic) and our liberties. OR, we can make a change in our policies and begin paying properly for what we need and use and can produce for ourselves.